# Chart
Managing background charts is also a common requirement. The chart here only recommends ECharts, full-featured, community demo is also rich gallery。
I still have that point of view. Most plug-ins recommend that use vue for packaging by yourself. It's really simple. ECharts supports the import of webpack, you can import the whole ECharts var echarts = require ('echarts') However, ECharts is not small, if you use only a small part of the features or chart type, then recommend on-demand import.
// Import on demand -- import ECharts main module
var echarts = require('echarts/lib/echarts')
// Import bar
require('echarts/lib/chart/bar')
// Import tooltip&title
require('echarts/lib/component/tooltip')
require('echarts/lib/component/title')

// Import all ECharts module
var echarts = require('echarts')
Include ECharts charts and components on demand
Next we will declare the initialization of ECharts in vue. Because ECharts initialization must be bound to dom, we can only initialize it during vue's mounted lifetime.
mounted() {
  this.initCharts();
},
methods: {
  initCharts() {
    this.chart = echarts.init(this.$el);
    this.setOptions();
  },
  setOptions() {
    this.chart.setOption({
      title: {
        text: 'ECharts 入门示例'
      },
      tooltip: {},
      xAxis: {
        data: ["衬衫", "羊毛衫", "雪纺衫", "裤子", "高跟鞋", "袜子"]
      },
      yAxis: {},
      series: [{
        name: '销量',
        type: 'bar',
        data: [5, 20, 36, 10, 10, 20]
      }]
    })
  }
}
It's that simple, ECharts is configured, at this point you want to say that my data is obtained remotely, or how do I dynamically change the configuration of ECharts? We can trigger the setOptions method with watch
// The first watch options change Using the depth of vue watcher, options are re-setOption
watch: {
  options: {
    handler(options) {
      this.chart.setOption(this.options)
    },
    deep: true
  },
}
// The second only watch data changes trigger ECharts only when the data changes
watch: {
  seriesData(val) {
    this.setOptions({series:val})
  }
}
In fact, they are all similar, or they must be combined with their own business. There is no difference between using ECharts in peacetime.
# Demo

Code
@/views/dashboard/admin/components
# ECharts chart width is displayed incorrectly?
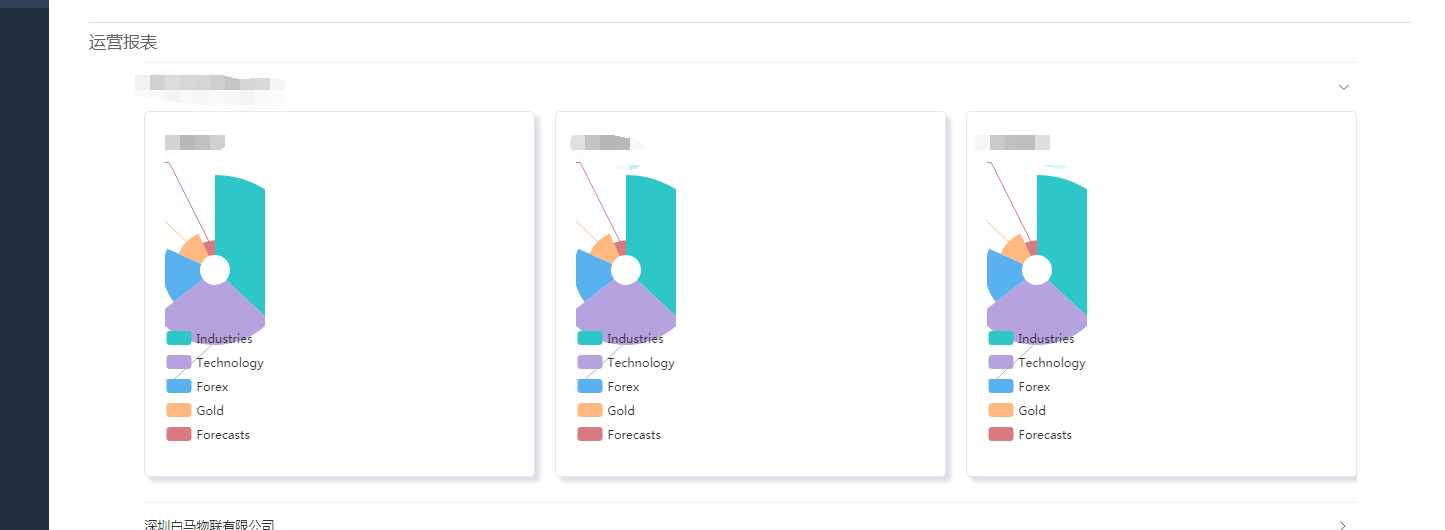
Sometimes you put ECharts in el-tab orel-dialog, and you will find that the width of the chart will be displayed incorrectly. As shown below:

Because ECharts itself is not adaptive, you need to manually call its .resize () method when the width of your parent container changes.
For example, el-tab, you can listen to thechange event, and call the .resize () method after finding the chart when the change occurs.
<template>
  <el-tabs v-model="active" @tab-click="handleClick">
    <el-tab-pane label="用户管理" name="first">
      <Chart ref="Chart" />
    </el-tab-pane>
    <el-tab-pane label="配置管理" name="second">配置管理</el-tab-pane>
    <el-tab-pane label="角色管理" name="third">角色管理</el-tab-pane>
    <el-tab-pane label="定时任务补偿" name="fourth">定时任务补偿</el-tab-pane>
  </el-tabs>
</template>

<script>
  export default {
    data() {
      return {
        active: 'second'
      };
    },
    watch: {
      active(val) {
        this.$nextTick(() => {
          this.$refs.Chart.resize();
        }
      }
    },
    methods: {
      handleClick(tab, event) {
        console.log(tab, event);
      }
    }
  };
</script>
It is relatively simple to put the chart in the el-dialog, as long as the init chart is displayed after the dialog appears.
# Others
Of course there are many other libraries in the community, such as d3 , Chart.js , chartist-js. The packaging methods are almost the same, and they are no longer here.